


Notebooks

Categories


Cells
Premium


BioTuring
Cell–cell communication mediated by ligand–receptor complexes is critical to coordinating diverse biological processes, such as development, differentiation and inflammation.
To investigate how the context-dependent crosstalk of different cell types enables physiological processes to proceed, we developed CellPhoneDB, a novel repository of ligands, receptors and their interactions. In contrast to other repositories, our database takes into account the subunit architecture of both ligands and receptors, representing heteromeric complexes accurately.
We integrated our resource with a statistical framework that predicts enriched cellular interactions between two cell types from single-cell transcriptomics data. Here, we outline the structure and content of our repository, provide procedures for inferring cell–cell communication networks from single-cell RNA sequencing data and present a practical step-by-step guide to help implement the protocol.
CellPhoneDB v.2.0 is an updated version of our resource that incorporates additional functionalities to enable users to introduce new interacting molecules and reduces the time and resources needed to interrogate large datasets.
CellPhoneDB v.2.0 is publicly available, both as code and as a user-friendly web interface; it can be used by both experts and researchers with little experience in computational genomics.
In our protocol, we demonstrate how to evaluate meaningful biological interactions with CellPhoneDB v.2.0 using published datasets. This protocol typically takes ~2 h to complete, from installation to statistical analysis and visualization, for a dataset of ~10 GB, 10,000 cells and 19 cell types, and using five threads.

BioTuring
Build single-cell trajectories with the software that introduced **pseudotime**. Find out about cell fate decisions and the genes regulated as they're made.
Group and classify your cells based on gene expression. Identify new cell types and states and the genes that distinguish them.
Find genes that vary between cell types and states, over trajectories, or in response to perturbations using statistically robust, flexible differential analysis.
In development, disease, and throughout life, cells transition from one state to another. Monocle introduced the concept of **pseudotime**, which is a measure of how far a cell has moved through biological progress.
Many researchers are using single-cell RNA-Seq to discover new cell types. Monocle 3 can help you purify them or characterize them further by identifying key marker genes that you can use in follow-up experiments such as immunofluorescence or flow sorting.
**Single-cell trajectory analysis** shows how cells choose between one of several possible end states. The new reconstruction algorithms introduced in Monocle 3 can robustly reveal branching trajectories, along with the genes that cells use to navigate these decisions.

BioTuring
Computational methods that model how the gene expression of a cell is influenced by interacting cells are lacking.
We present NicheNet, a method that predicts ligand–target links between interacting cells by combining their expression data with prior knowledge of signaling and gene regulatory networks.
We applied NicheNet to the tumor and immune cell microenvironment data and demonstrated that NicheNet can infer active ligands and their gene regulatory effects on interacting cells.

BioTuring
Single-cell RNA sequencing methods can profile the transcriptomes of single cells but cannot preserve spatial information. Conversely, spatial transcriptomics assays can profile spatial regions in tissue sections but do not have single-cell resolution.
Here, Runmin Wei (Siyuan He, Shanshan Bai, Emi Sei, Min Hu, Alastair Thompson, Ken Chen, Savitri Krishnamurthy & Nicholas E. Navin) developed a computational method called CellTrek that combines these two datasets to achieve single-cell spatial mapping through coembedding and metric learning approaches. They benchmarked CellTrek using simulation and in situ hybridization datasets, which demonstrated its accuracy and robustness.
They then applied CellTrek to existing mouse brain and kidney datasets and showed that CellTrek can detect topological patterns of different cell types and cell states. They performed single-cell RNA sequencing and spatial transcriptomics experiments on two ductal carcinoma in situ tissues and applied CellTrek to identify tumor subclones that were restricted to different ducts, and specific T-cell states adjacent to the tumor areas.
Trends
BioTuring
This tool provides a user-friendly and automated way to analyze large-scale single-cell RNA-seq datasets stored in RDS (Seurat) format. It allows users to run various analysis tools on their data in one command, streamlining the analysis workflow and(More)
BioTuring
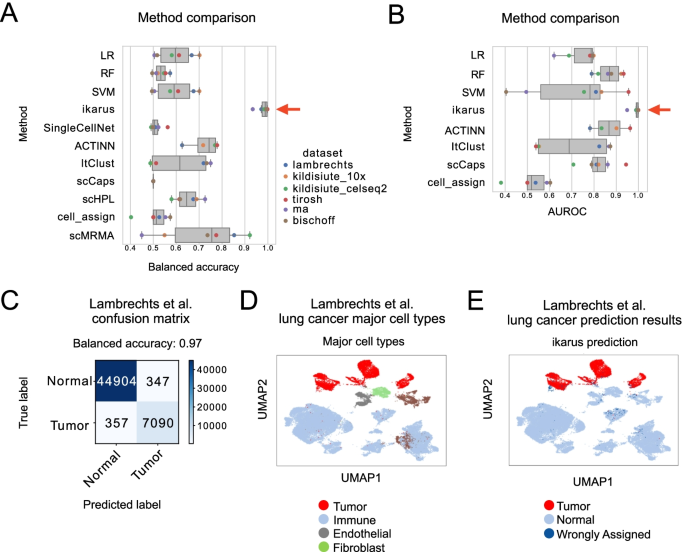
Tumors are complex tissues of cancerous cells surrounded by a heterogeneous cellular microenvironment with which they interact. Single-cell sequencing enables molecular characterization of single cells within the tumor. However, cell annotation—the(More)