


Notebooks

Categories


Cells
Premium


BioTuring
The recent development of experimental methods for measuring chromatin state at single-cell resolution has created a need for computational tools capable of analyzing these datasets. Here we developed Signac, a framework for the analysis of single-cell chromatin data, as an extension of the Seurat R toolkit for single-cell multimodal analysis.
**Signac** enables an end-to-end analysis of single-cell chromatin data, including peak calling, quantification, quality control, dimension reduction, clustering, integration with single-cell gene expression datasets, DNA motif analysis, and interactive visualization.
Furthermore, Signac facilitates the analysis of multimodal single-cell chromatin data, including datasets that co-assay DNA accessibility with gene expression, protein abundance, and mitochondrial genotype. We demonstrate scaling of the Signac framework to datasets containing over 700,000 cells.

BioTuring
Recent technological advancements have enabled spatially resolved transcriptomic profiling but at multi-cellular pixel resolution, thereby hindering the identification of cell-type-specific spatial patterns and gene expression variation.
To address this challenge, we develop STdeconvolve as a reference-free approach to deconvolve underlying cell types comprising such multi-cellular pixel resolution spatial transcriptomics (ST) datasets. Using simulated as well as real ST datasets from diverse spatial transcriptomics technologies comprising a variety of spatial resolutions such as Spatial Transcriptomics, 10X Visium, DBiT-seq, and Slide-seq, we show that STdeconvolve can effectively recover cell-type transcriptional profiles and their proportional representation within pixels without reliance on external single-cell transcriptomics references.
**STdeconvolve** provides comparable performance to existing reference-based methods when suitable single-cell references are available, as well as potentially superior performance when suitable single-cell references are not available.
STdeconvolve is available as an open-source R software package with the source code available at https://github.com/JEFworks-Lab/STdeconvolve .

BioTuring
Single-cell RNA sequencing (scRNA-seq) protocols often face challenges in measuring the expression of all genes within a cell due to various factors, such as technical noise, the sensitivity of scRNA-seq techniques, or sample quality. This limitation gives rise to a need for the prediction of unmeasured gene expression values (also known as dropout imputation) from scRNA-seq data.
ADImpute (Leote A, 2023) is an R package combining several dropout imputation methods, including two existing methods (DrImpute, SAVER), two novel implementations: Network, a gene regulatory network-based approach using gene-gene relationships learned from external data, and Baseline, a method corresponding to a sample-wide average..
This notebook is to illustrate an example workflow of ADImpute on sample datasets loaded from the package. The notebook content is inspired from ADImpute's vignette and modified to demonstrate how the tool works on BioTuring's platform.
BioTuring
The recent development of single-cell RNA-sequencing (scRNA-seq) technology has enabled us to infer cell-type-specific co-expression networks, enhancing our understanding of cell-type-specific biological functions. However, existing methods proposed for this task still face challenges due to unique characteristics in scRNA-seq data, such as high sequencing depth variations across cells and measurement errors.
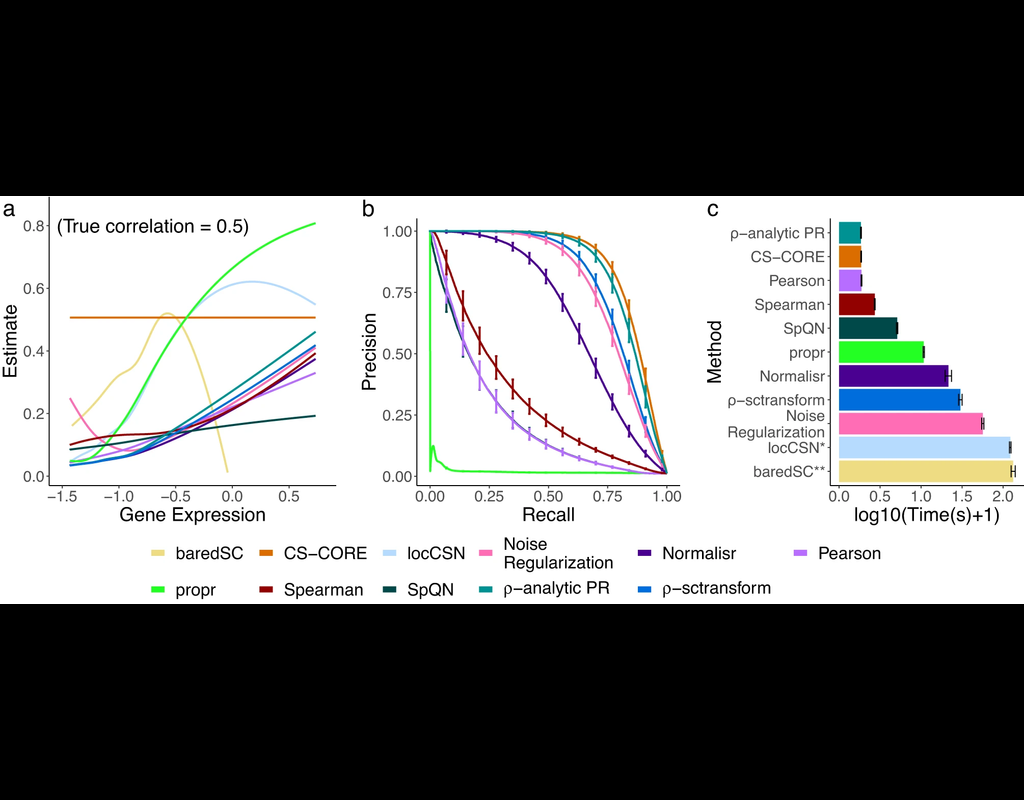
CS-CORE (Su, C., Xu, Z., Shan, X. et al., 2023), an R package for cell-type-specific co-expression inference, explicitly models sequencing depth variations and measurement errors in scRNA-seq data.
In this notebook, we will illustrate an example workflow of CS-CORE using a dataset of Peripheral Blood Mononuclear Cells (PBMC) from COVID patients and healthy controls (Wilk et al., 2020). The notebook content is inspired by CS-CORE's vignette and modified to demonstrate how the tool works on BioTuring's platform.
Trends

BioTuring
Charting an organs’ biological atlas requires us to spatially resolve the entire single-cell transcriptome, and to relate such cellular features to the anatomical scale. Single-cell and single-nucleus RNA-seq (sc/snRNA-seq) can profile cells compre(More)