


Notebooks

Categories


Cells
Premium


BioTuring
Single-cell RNA sequencing (scRNA-seq) protocols often face challenges in measuring the expression of all genes within a cell due to various factors, such as technical noise, the sensitivity of scRNA-seq techniques, or sample quality. This limitation gives rise to a need for the prediction of unmeasured gene expression values (also known as dropout imputation) from scRNA-seq data.
ADImpute (Leote A, 2023) is an R package combining several dropout imputation methods, including two existing methods (DrImpute, SAVER), two novel implementations: Network, a gene regulatory network-based approach using gene-gene relationships learned from external data, and Baseline, a method corresponding to a sample-wide average..
This notebook is to illustrate an example workflow of ADImpute on sample datasets loaded from the package. The notebook content is inspired from ADImpute's vignette and modified to demonstrate how the tool works on BioTuring's platform.
BioTuring
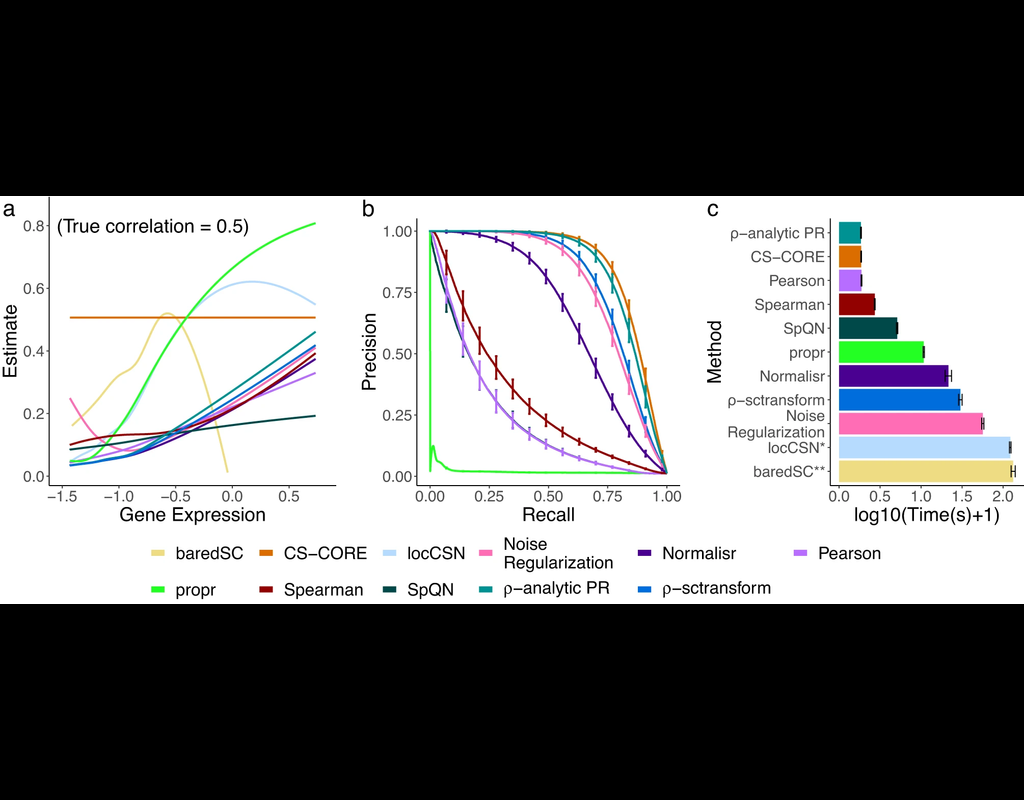
The recent development of single-cell RNA-sequencing (scRNA-seq) technology has enabled us to infer cell-type-specific co-expression networks, enhancing our understanding of cell-type-specific biological functions. However, existing methods proposed for this task still face challenges due to unique characteristics in scRNA-seq data, such as high sequencing depth variations across cells and measurement errors.
CS-CORE (Su, C., Xu, Z., Shan, X. et al., 2023), an R package for cell-type-specific co-expression inference, explicitly models sequencing depth variations and measurement errors in scRNA-seq data.
In this notebook, we will illustrate an example workflow of CS-CORE using a dataset of Peripheral Blood Mononuclear Cells (PBMC) from COVID patients and healthy controls (Wilk et al., 2020). The notebook content is inspired by CS-CORE's vignette and modified to demonstrate how the tool works on BioTuring's platform.

BioTuring
Understanding global communications among cells requires accurate representation of cell-cell signaling links and effective systems-level analyses of those links.
We construct a database of interactions among ligands, receptors and their cofactors that accurately represent known heteromeric molecular complexes. We then develop **CellChat**, a tool that is able to quantitatively infer and analyze intercellular communication networks from single-cell RNA-sequencing (scRNA-seq) data.
CellChat predicts major signaling inputs and outputs for cells and how those cells and signals coordinate for functions using network analysis and pattern recognition approaches. Through manifold learning and quantitative contrasts, CellChat classifies signaling pathways and delineates conserved and context-specific pathways across different datasets.
Applying **CellChat** to mouse and human skin datasets shows its ability to extract complex signaling patterns.
BioTuring
Cell2location is a principled Bayesian model that can resolve fine-grained cell types in spatial transcriptomic data and create comprehensive cellular maps of diverse tissues. Cell2location accounts for technical sources of variation and borrows statistical strength across locations, thereby enabling the integration of single cell and spatial transcriptomics with higher sensitivity and resolution than existing tools. This is achieved by estimating which combination of cell types in which cell abundance could have given the mRNA counts in the spatial data, while modelling technical effects (platform/technology effect, contaminating RNA, unexplained variance).
This tutorial shows how to use cell2location method for spatially resolving fine-grained cell types by integrating 10X Visium data with scRNA-seq reference of cell types. Cell2location is a principled Bayesian model that estimates which combination of cell types in which cell abundance could have given the mRNA counts in the spatial data, while modelling technical effects (platform/technology effect, contaminating RNA, unexplained variance).
Trends
BioTuring
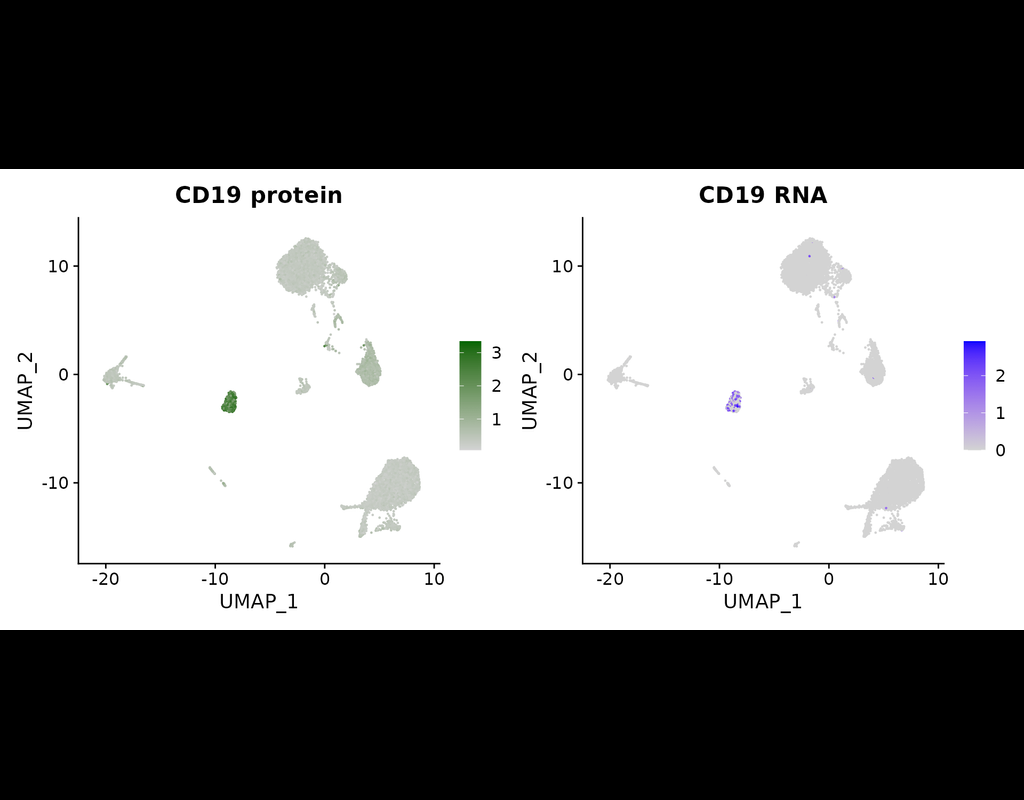
The simultaneous measurement of multiple modalities represents an exciting frontier for single-cell genomics and necessitates computational methods that can define cellular states based on multimodal data.
Here, we introduce "weighted-nearest nei(More)