


Notebooks

Categories


Cells
Premium


BioTuring
Power analyses are considered important factors in designing high-quality experiments. However, such analyses remain a challenge in single-cell RNA-seq studies due to the presence of hierarchical structure within the data (Zimmerman et al., 2021). As cells sampled from the same individual share genetic and environmental backgrounds, these cells are more correlated than cells sampled from different individuals. Currently, most power analyses and hypothesis tests (e.g., differential expression) in scRNA-seq data treat cells as if they were independent, thus ignoring the intra-sample correlation, which could lead to incorrect inferences.
Hierarchicell (Zimmerman, K.D. and Langefeld, C.D., 2021) is an R package proposed to estimate power for testing hypotheses of differential expression in scRNA-seq data while considering the hierarchical correlation structure that exists in the data. The method offers four important categories of functions: data loading and cleaning, empirical estimation of distributions, simulating expression data, and computing type 1 error or power.
In this notebook, we will illustrate an example workflow of Hierarchicell. The notebook is inspired by Hierarchicell's vignette and modified to demonstrate how the tool works on BioTuring's platform.

BioTuring
The development of immune checkpoint-based immunotherapies has been a major advancement in the treatment of cancer, with a subset of patients exhibiting durable clinical responses. A predictive biomarker for immunotherapy response is the pre-existing T-cell infiltration in the tumor immune microenvironment (TIME).
Bulk transcriptomics-based approaches can quantify the degree of T-cell infiltration using deconvolution methods and identify additional markers of inflamed/cold cancers at the bulk level. However, bulk techniques are unable to identify biomarkers of individual cell types. Although single-cell RNA sequencing (scRNAseq) assays are now being used to profile the TIME, to our knowledge there is no method of identifying patients with a T-cell inflamed TIME from scRNAseq data. Here, we describe a method, iBRIDGE, which integrates reference bulk RNAseq data with the malignant subset of scRNAseq datasets to identify patients with a T-cell inflamed TIME.
Utilizing two datasets with matched bulk data, we show iBRIDGE results correlated highly with bulk assessments (0.85 and 0.9 correlation coefficients). Using iBRIDGE, we identified markers of inflamed phenotypes in malignant cells, myeloid cells, and fibroblasts, establishing type I and type II interferon pathways as dominant signals, especially in malignant and myeloid cells, and finding the TGFβ-driven mesenchymal phenotype not only in fibroblasts but also in malignant cells.
Besides relative classification, per-patient average iBRIDGE scores and independent RNAScope quantifications were utilized for threshold-based absolute classification. Moreover, iBRIDGE can be applied to in vitro grown cancer cell lines and can identify the cell lines that are adapted from inflamed/cold patient tumors.

BioTuring
Build single-cell trajectories with the software that introduced **pseudotime**. Find out about cell fate decisions and the genes regulated as they're made.
Group and classify your cells based on gene expression. Identify new cell types and states and the genes that distinguish them.
Find genes that vary between cell types and states, over trajectories, or in response to perturbations using statistically robust, flexible differential analysis.
In development, disease, and throughout life, cells transition from one state to another. Monocle introduced the concept of **pseudotime**, which is a measure of how far a cell has moved through biological progress.
Many researchers are using single-cell RNA-Seq to discover new cell types. Monocle 3 can help you purify them or characterize them further by identifying key marker genes that you can use in follow-up experiments such as immunofluorescence or flow sorting.
**Single-cell trajectory analysis** shows how cells choose between one of several possible end states. The new reconstruction algorithms introduced in Monocle 3 can robustly reveal branching trajectories, along with the genes that cells use to navigate these decisions.

BioTuring
Cell–cell communication mediated by ligand–receptor complexes is critical to coordinating diverse biological processes, such as development, differentiation and inflammation.
To investigate how the context-dependent crosstalk of different cell types enables physiological processes to proceed, we developed CellPhoneDB, a novel repository of ligands, receptors and their interactions. In contrast to other repositories, our database takes into account the subunit architecture of both ligands and receptors, representing heteromeric complexes accurately.
We integrated our resource with a statistical framework that predicts enriched cellular interactions between two cell types from single-cell transcriptomics data. Here, we outline the structure and content of our repository, provide procedures for inferring cell–cell communication networks from single-cell RNA sequencing data and present a practical step-by-step guide to help implement the protocol.
CellPhoneDB v.2.0 is an updated version of our resource that incorporates additional functionalities to enable users to introduce new interacting molecules and reduces the time and resources needed to interrogate large datasets.
CellPhoneDB v.2.0 is publicly available, both as code and as a user-friendly web interface; it can be used by both experts and researchers with little experience in computational genomics.
In our protocol, we demonstrate how to evaluate meaningful biological interactions with CellPhoneDB v.2.0 using published datasets. This protocol typically takes ~2 h to complete, from installation to statistical analysis and visualization, for a dataset of ~10 GB, 10,000 cells and 19 cell types, and using five threads.
Trends
BioTuring
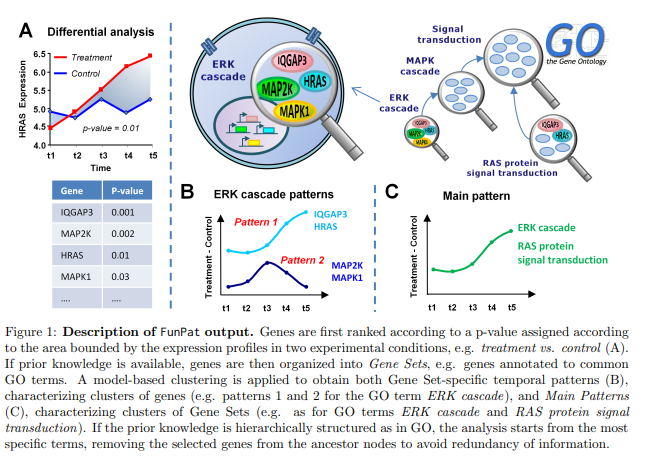
Dynamic expression data, nowadays obtained using high-throughput RNA sequencing (RNA-seq), are essential to monitor transient gene expression changes and to study the dynamics of their transcriptional activity in the cell or response to stimuli. FunP(More)